
User Interface / Command Reference
Overview
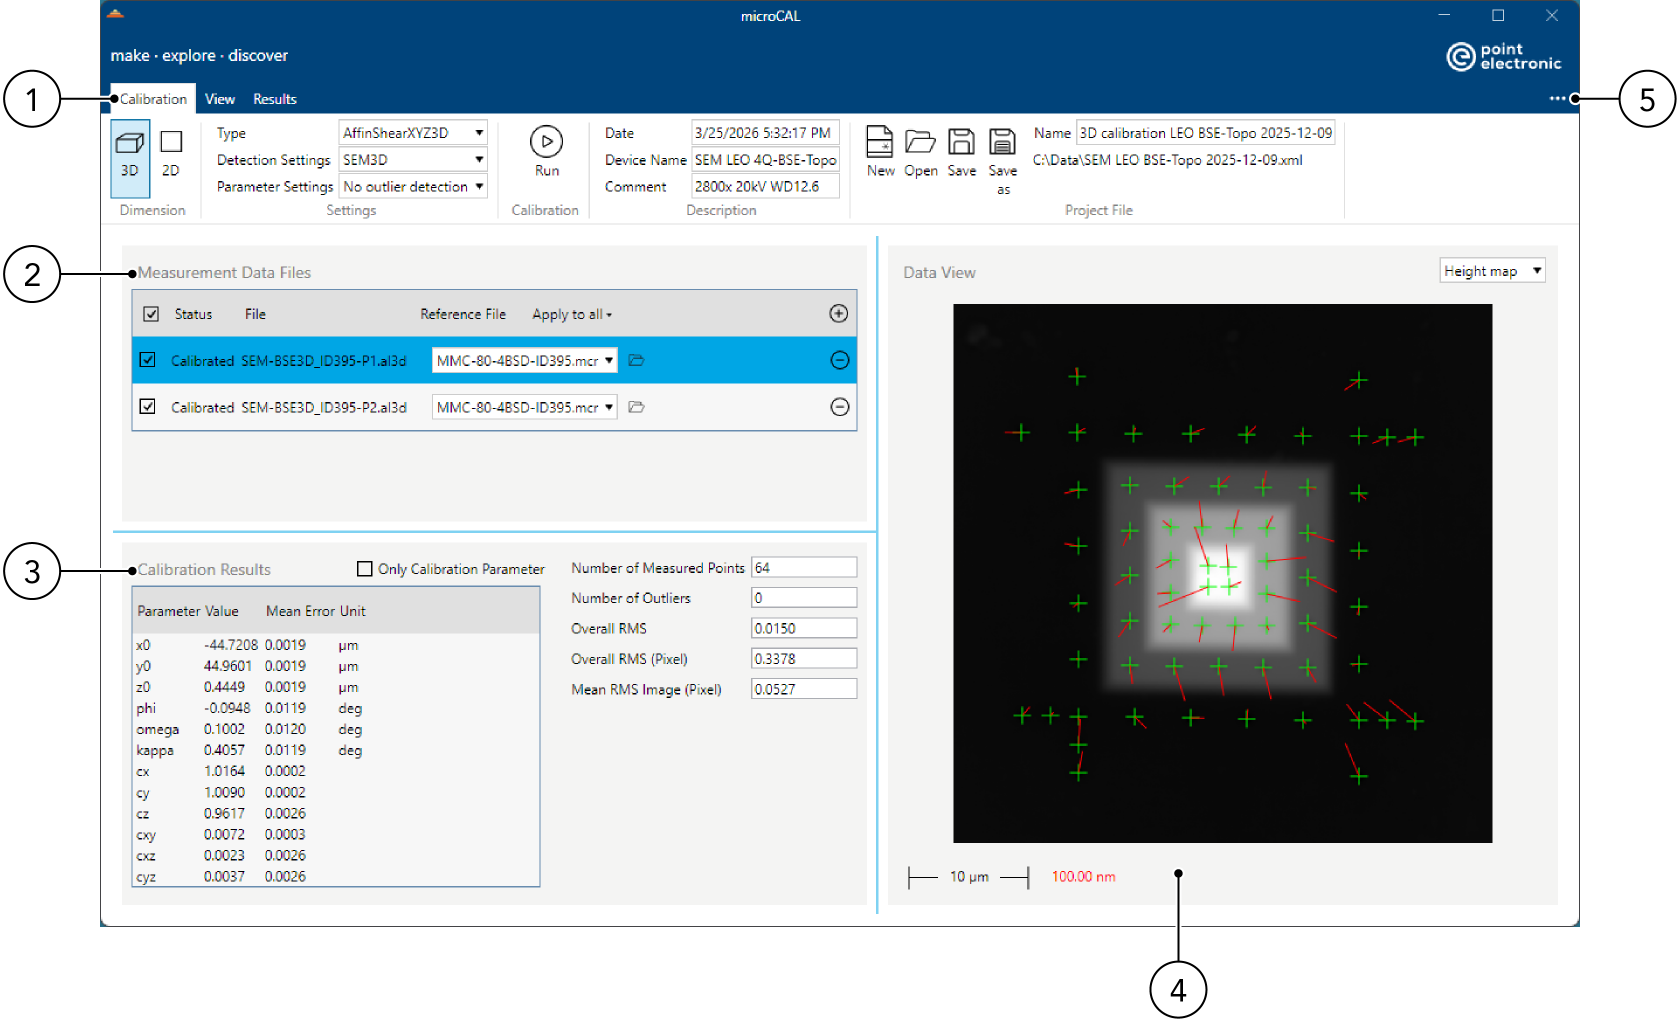
| No. | Component | Description/function |
|---|---|---|
| 1 | Toolbars | see Toolbars |
| 2 | Measurement Data Files | List of measurement data with reference files |
| 3 | Calibration Results | Results of the calibration |
| 4 | Data View | Display and analysis of measurement data |
| 5 | Help menu | Links to help ressources and software information |
NOTICE
The size of the sections can be customized by dragging the dividing lines with the mouse.
Measurement Data Files
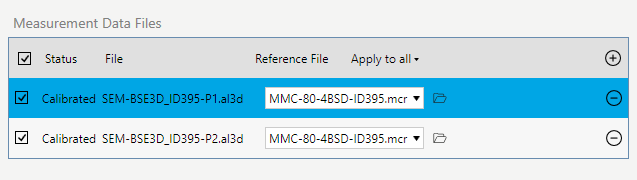
This section contains a list of the loaded measurement data for the calibration sample and the associated reference file(s). The list is used to specify the files to be included in the calibration.
Component |
Description/function |
|---|---|
| Checkbox | Selection of entries to be included in the calibration |
| Status | Information on the processing status and error messages |
| File | Name of the image file (2D) or the file containing the topographic measurement data (3D) for the calibration sample. Loading and removing files via the (+) and (-) buttons on the right side of the measurement data list. |
| Reference File | Display the file name and selecting the reference file. Clicking the folder icon loads a reference file in XML or MCR format. If multiple reference files have been loaded, you can use the drop-down menu to assign the reference file that corresponds to the respective measurement data. |
| Apply to all | Selecting a loaded reference file as the reference for all measurement data in the list. |
| (+) | Loading a file containing image or topographic measurement data |
| (-) | Removing an entry (previously loaded file) from the list |
Overview of supported image and topographic data formats: Supported data file formats.
Calibration Results
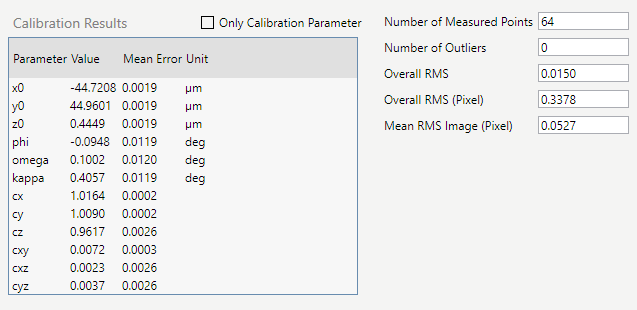
In this section, the results of the calibration are displayed.
| Component | Description/function |
|---|---|
| List of results | Contains the determined calibration parameters and their mean error |
| Only calibration parameter | activated = The rigid parameters (datum parameters, i.e., translations and rotations) are hidden. This can be helpful for getting a better overview of the results obtained. |
The values explained below are derived from statistical calculations and allow for the evaluation of the calibration results.
| Value | Description/function |
|---|---|
| Number of Measured Points | Number of calibration marks measured and used for calibration |
| Number of Outliers | Number of calibration marks excluded using a statistical outlier test |
| Overall RMS | Mean value of the root mean square (RMS) errors in the coordinate units of all calibration marks considered |
| Overall RMS (Pixel) | "Overall RMS" converted to pixels |
| Mean RMS Image (Pixel) | Mean of the mean root mean square errors of the calibration mark centers successfully measured using image processing (in pixels) |
Data View
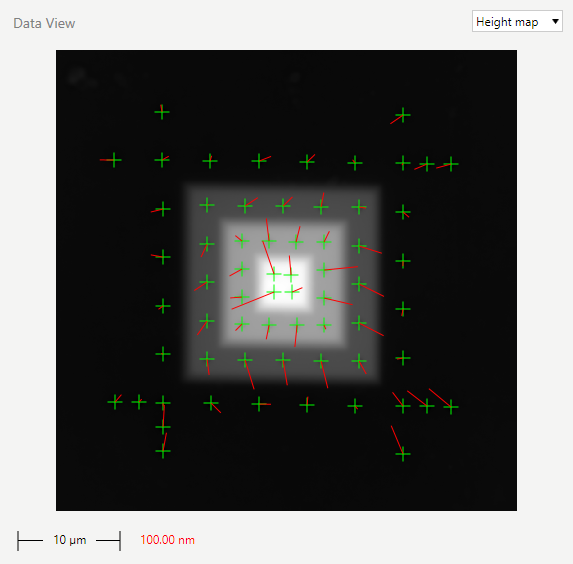
This section displays the image data (2D) or topographic data in the form of elevation-coded grayscale images (3D). If the data format supports multiple channels, you can select the desired channel.
NOTICE
If a topographic data format supports both image and topographic channels, the topographic channel is always used for (3D) calibration.
Use the tools in the "View" toolbar to change the following display settings:
- Zoom level (can also be adjusted using the mouse wheel)
- Image detail (can also be moved while holding down the left mouse button)
- Selection, color, and size of the graphical elements (measured calibration marks and error vectors)
- Brightness and contrast
The Save > Image function allows you to save the current view as an image file.
The image scale is displayed in the lower-left corner. If error vector display is enabled, the scale for the error vectors is displayed next to the image scale.
NOTICE
Use a scale of > 1 to display the error vectors. This allows you to analyze the error vectors more easily, since they are shown enlarged on the screen.