
Spectrum pane
Current spectrum is displayed as an interactive plot in the app, either changing during a live acquisition, or the last spectrum from a completed acquisition - as displayed in the screenshot below.
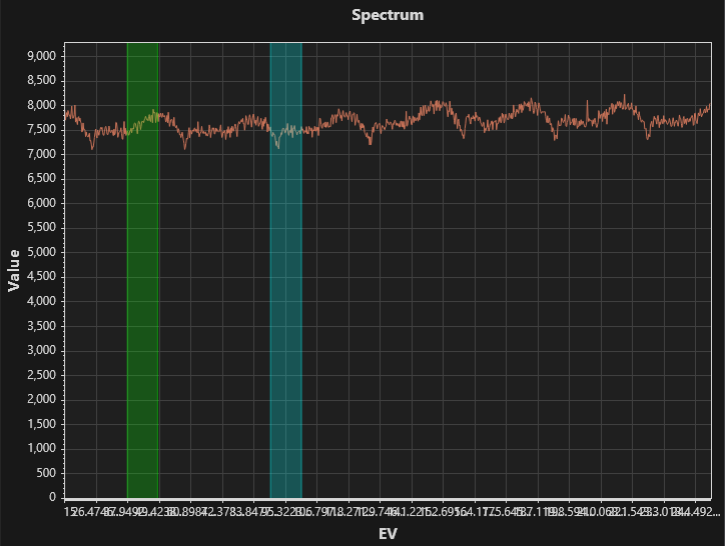
Use the mouse left click to drag the plot and the scroll wheel to zoom at mouse position. To auto-scale the plot, click right on the plot and select 'Autoscale'. To copy the plot as an image to Clipboard or to save to disk, click right on the plot to open the context menu.
Position the mouse pointer on an axis, horizontal or vertical, and use the scroll wheel to zoom in only on that axis.
Click, hold and drag mouse to reposition a span under the mouse. Click, holder and drag mouse on a span edge to resize it.