How To Compare Quantitative Images
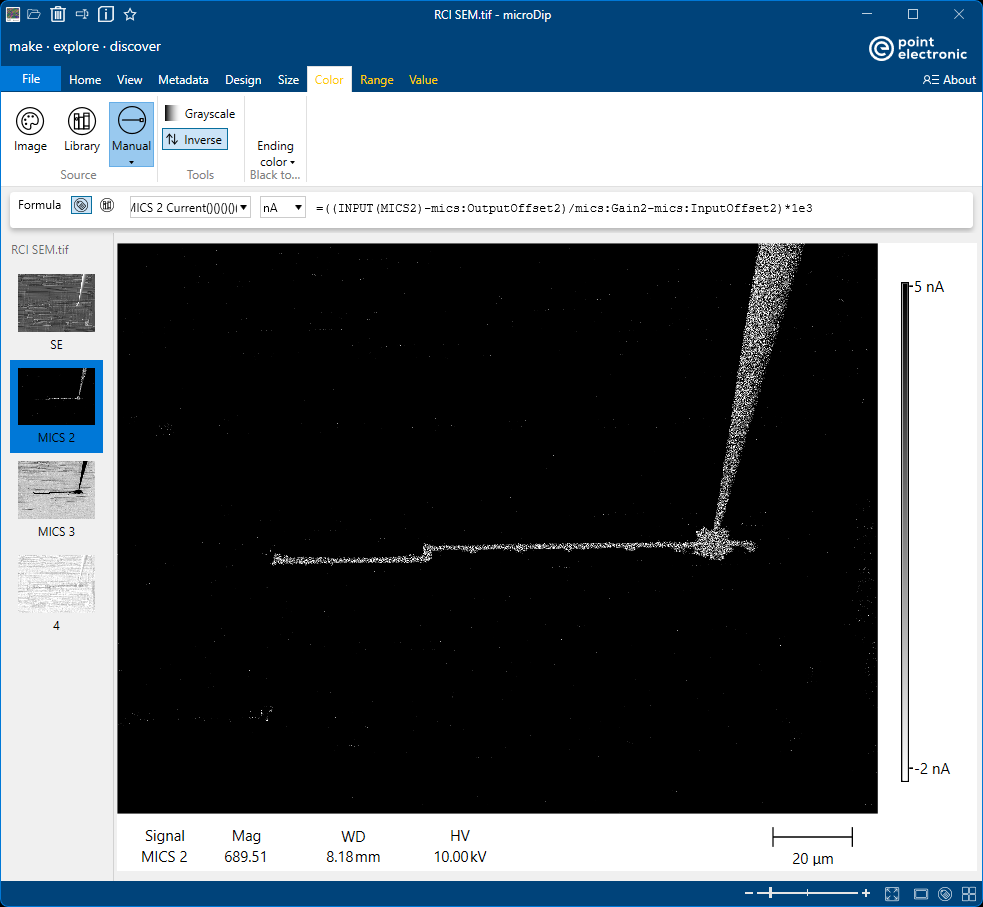
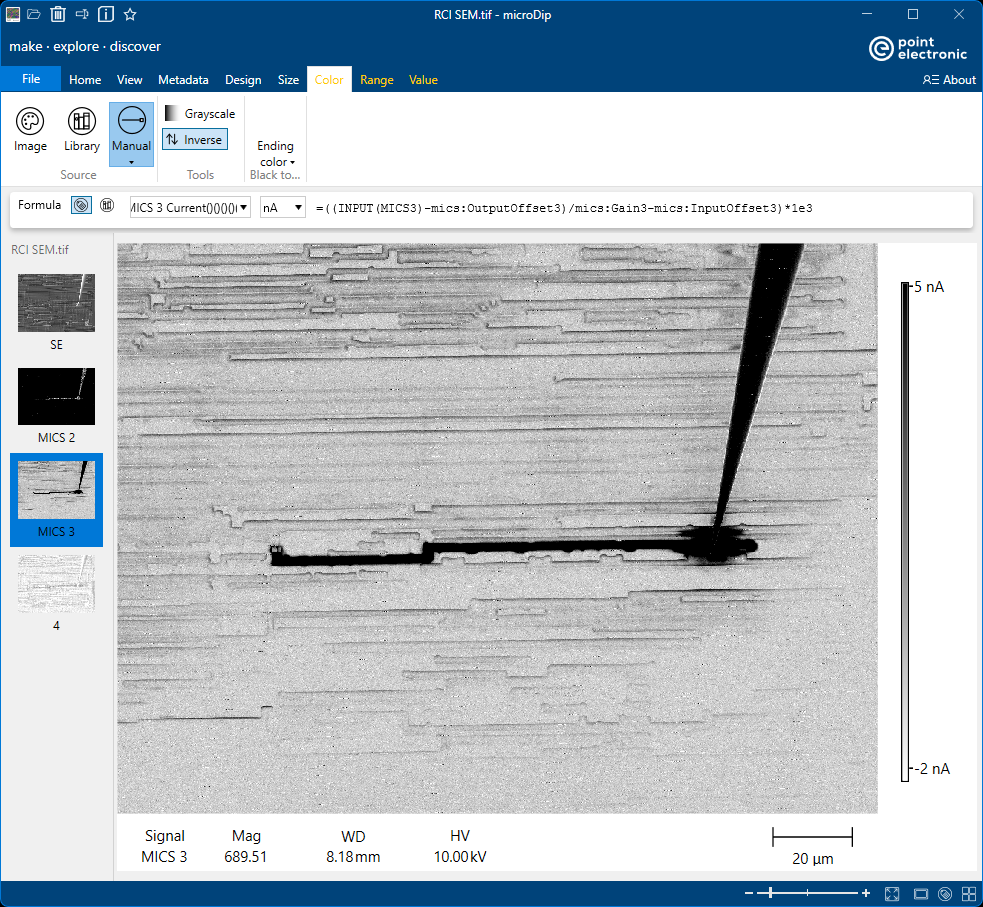
For a quantitative comparison between different signals or images, where the black and white levels are set to the same physical signal levels, set the same
- Formula in the Formula bar
- Minimum and Maximum values in the Range toolbar
- Colour and inverse in the Colour toolbar
for both signals or images, as in the example inserted below. Note that Intensity Bars in the two images have the same range -2 nA to 5 nA.