How To Colour Mix
Mixing of multiple signals acquired at the same time it's a key tool for visualisation of complex datasets. With microDIP, it's used primarily for localisation in Electrical Failure Analysis (EFA) and for grouping of signals in highly-segmented detectors. It it also used routinely used for EDS maps, as well high-quality photographic quality colour images - see nanoflight® - microstructure in motion
Prerequisites
Mixing tool will be enabled only for multi-page images, as it can only be applied to simultaneous signals. It will be enabled for 16-bit, 8-bit and Index8 images, but disabled for 24-bit RGB images.
EFA Localisation
Please load the 'EBIRCH.tif' file from the sample images. A typical approach will be used here, where
- SE signal is kept in the original grayscale to provide a larger field of view and to preserve a natural reference view of the image location/context
- EA.EFA signal is coloured to pinpoint location of a particular feature
then the images are mixed in colour.
Add colour
Select the second signal (LIA) and colourise the image with Color > Manual > Monochrome as in the screenshot below
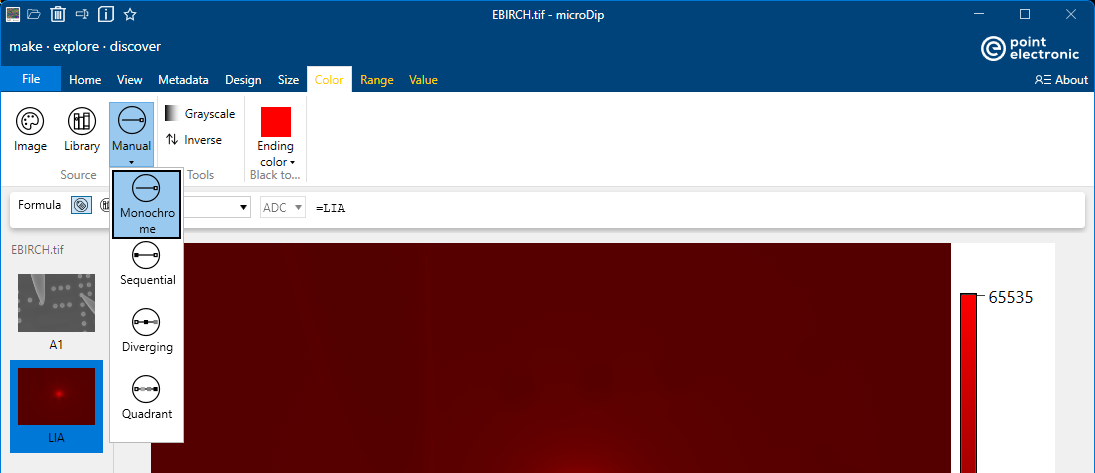
Select an ending colour that suits the purpose - red is commonly used in EFA.
Turn background black
Two methods are possible, histogram range or pixel range picker.
The easiest method is probably the Home > Histogram > Range tool. Open the histogram plot and click on the hashed range in the plot to select it, then change the minimum and maximum image until only the relevant feature appears red - all else is black.
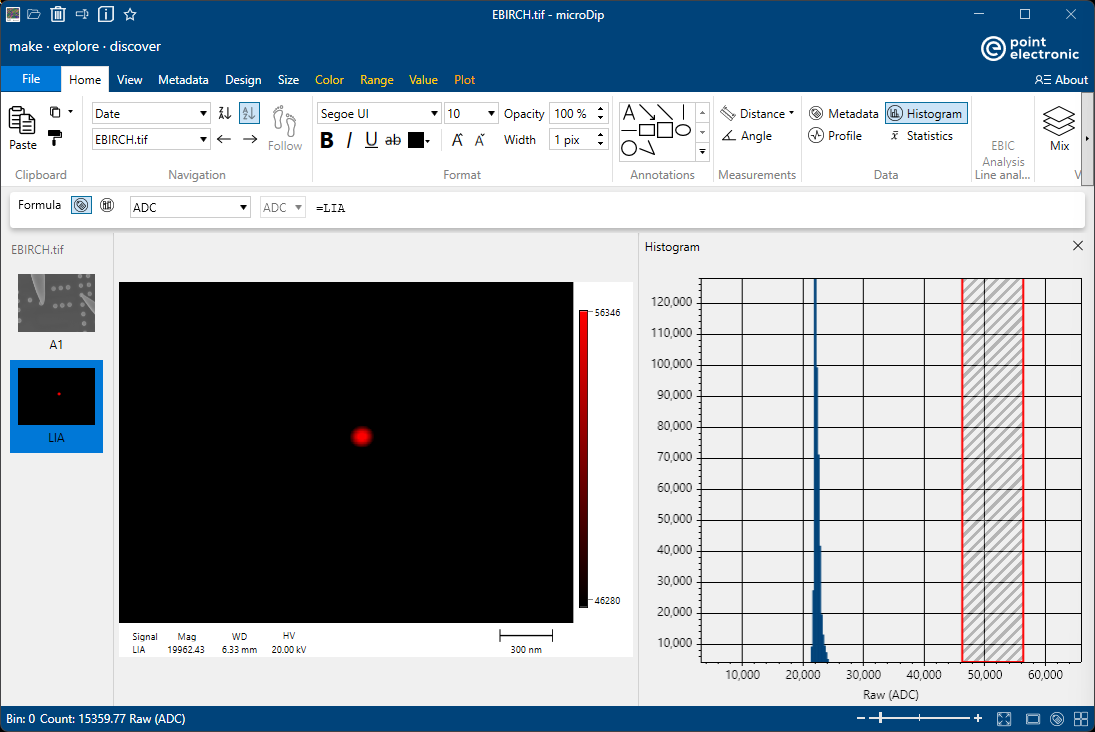
The fastest method is to zoom into the feature of interest with the mouse scroll wheel and then
- click right in the middle of the feature of interest and select 'Set maximum range'
- click right in next to the feature of interest and select 'Set minimum range'
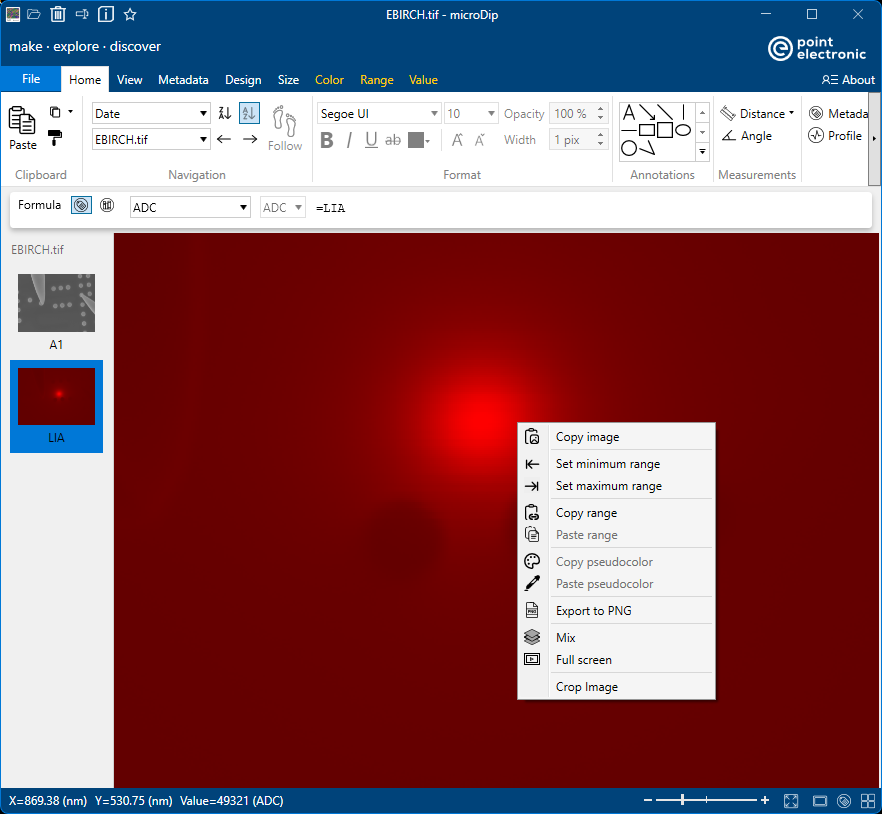
Both methods give the same results, it's only a matter of user preference.
Mix
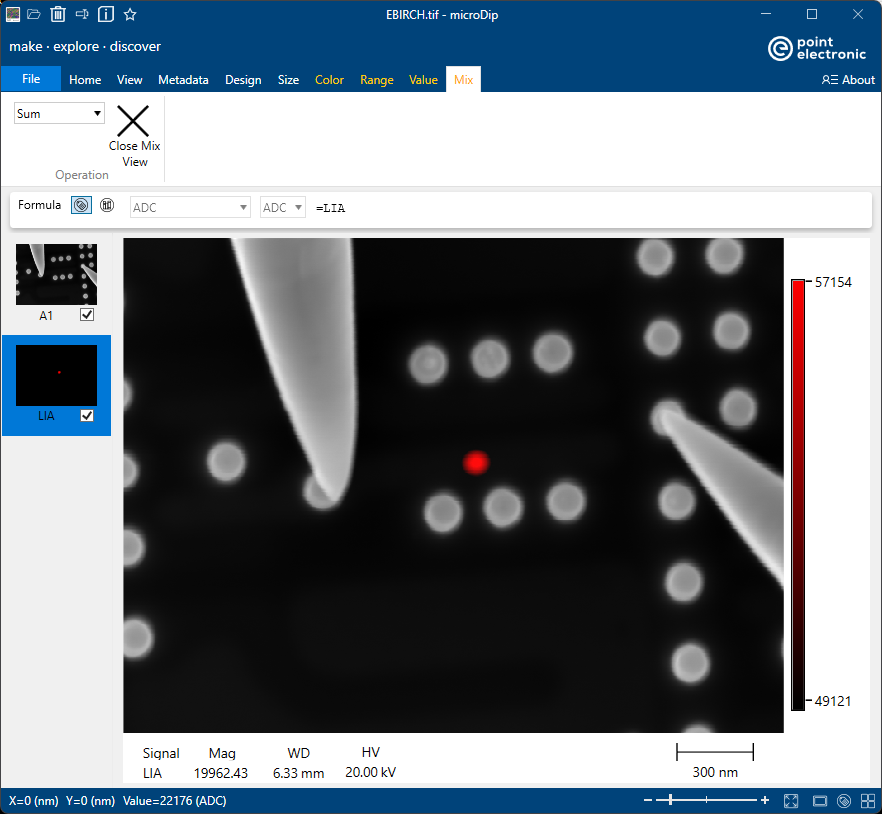
Use the Home > View > Mix tool, and select both signals in the left side panel. Make sure that 'Sum' is used in the Mix
Export
To export the mixed image, use File > Export > Image, use the automatic file name or write new, and choose desired location.
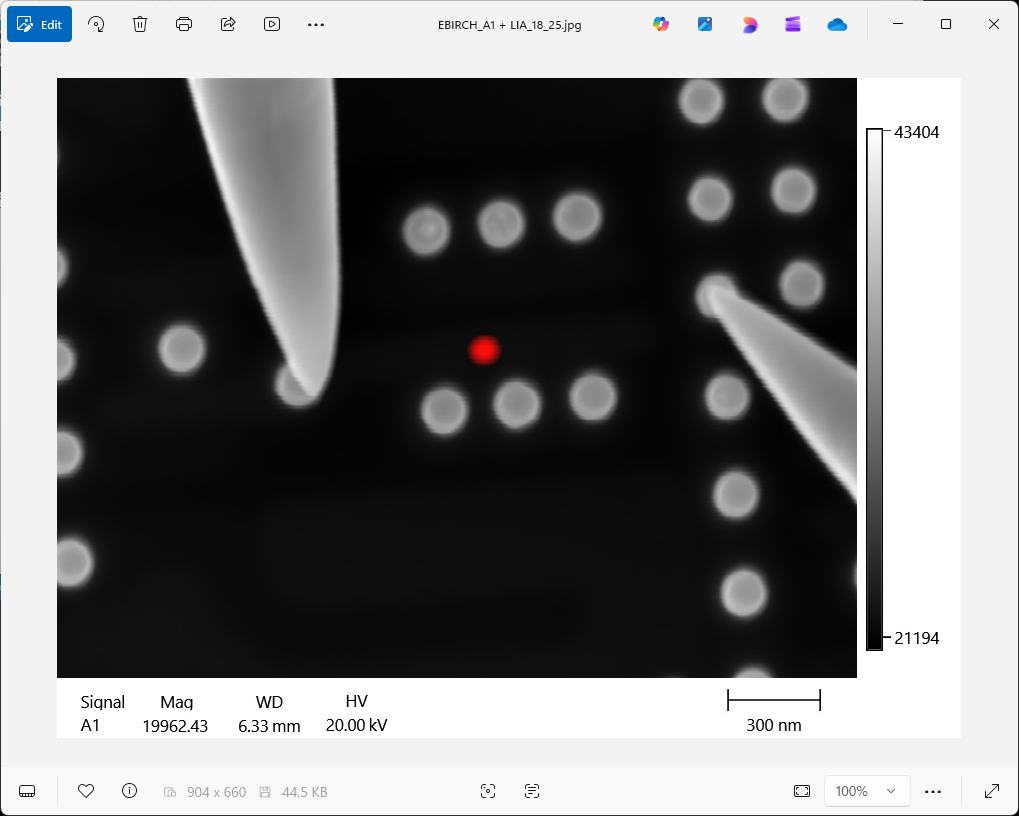
A few file formats are available for export
- JPEG file format will export only the mixed signal, including metadata
- TIF file format will export the original and the mixed signals, including metadata
- PNG file format will export only the mixed signal, without metadata
If the mixed image is meant for reports, but further distance measurements will be needed on the mixed image, then choose JPEG. It the image is not meant for reports, then use the multi-page TIF format. If metadata must be removed for confidentiality reasons, then choose PNG.
Segmented Detectors
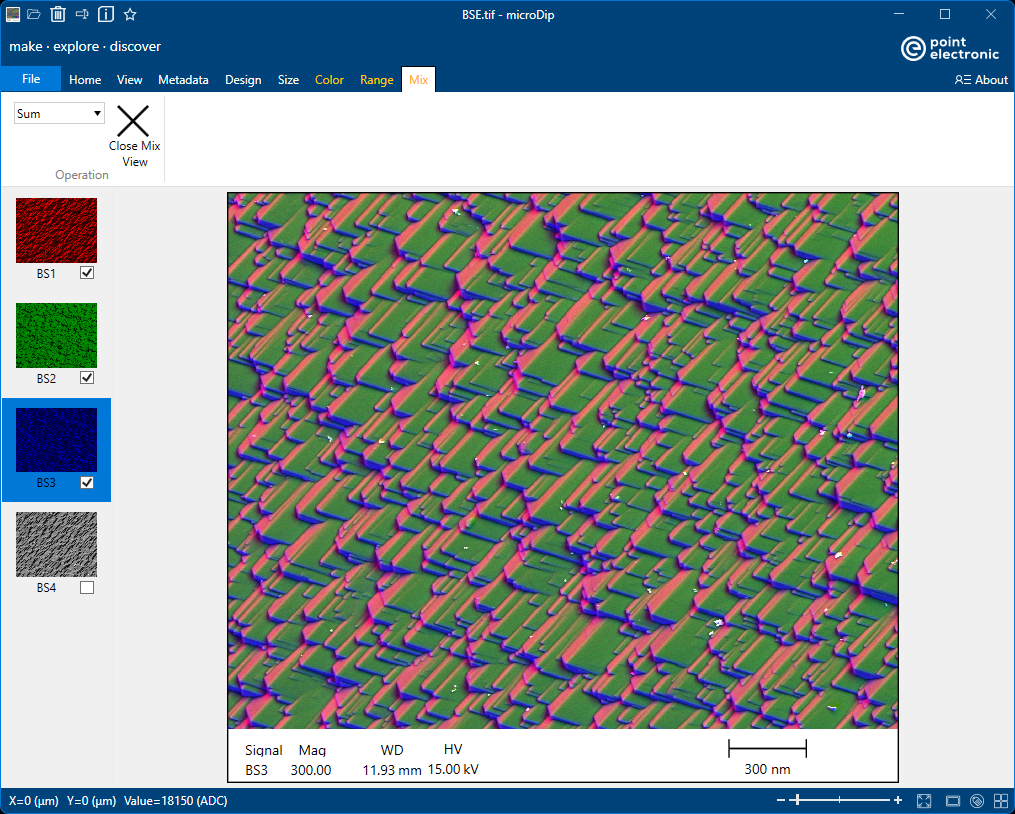
Open the 'BSE.tif' sample image and select Home > Tools > Mix, choose Mix > Operation > Average and select all four signals in the left side panel. For BSE signals such as this, averaging signals is equivalent to a 'Compo' mix

For completeness, a colour mix is also possible. Select first three signals only in the left side panel, choose Mix > Operation > Sum and choose Color > Source > Manual > Monochrome for each to change colours to red, green, blue.