Pixel Value Quantification
Prerequisites
For intensity calibration/quantification to work
- metadata much contain the necessary hardware values as tags
- scan controller hardware has to be calibrated the particular signal/channel
- images must be saved without compression, which means 16-bit depth
To verify that a file is recorded in 16-bit depth, if the file is already open in microDIP, press the File Information button in the Quick Access Toolbar, as shown in the screenshot below.

This will open the native Microsoft Windows File Property windows, where select the Details tab and look for the 'Bit depth' property.
Pixel Values Intensity Calibration
point electronic GmbH scan controllers are fully calibrated in the factory, therefore images acquired with either REVOLON or DISS6 scan controllers contain pixel intensities (pixel values) that can be calculated, displayed and exported as physical values in the microscope. Typical examples include signal level (V) at the input of the scan controller, or signal current (pA) at the input of a detector or Electrical Analysis (EA) system. These pixel values are calculated on the fly from the raw (ADC) pixel values and a combination of tag values and formulas in the metadata.
Similar with pixel size calibration information, which is shown in microscopy with a Scale Bar, pixel intensity calibration information is shown with an Intensity Bar. This shows the relationship between physical signal values in the microscope to image view grayscale (or colour) on screen. For example, in the screenshot below we have an intensity bar that informs that
- -9.58 nA in the signal is displayed as black on the display
- 18.24 nA in the signal is displayed as white on the display
- there is a constant gradient (change) from black to white on the display
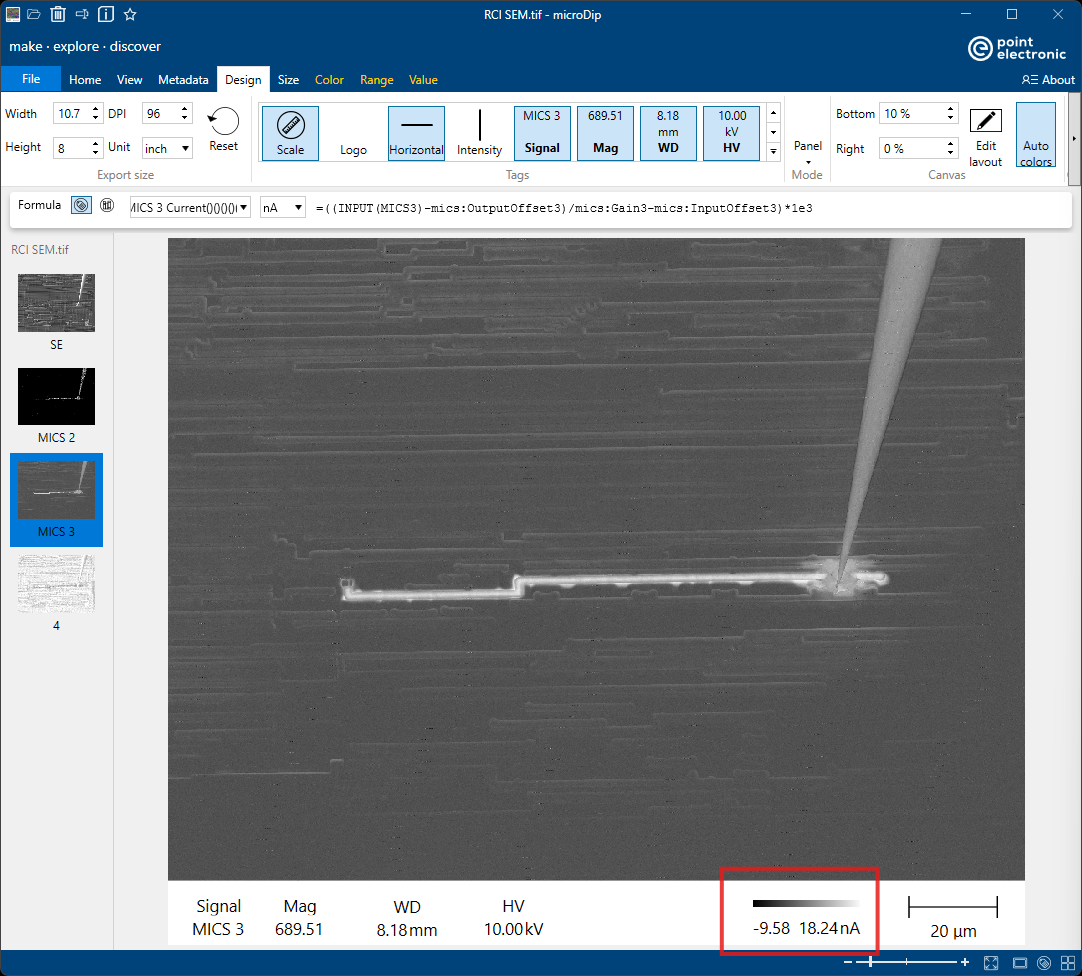
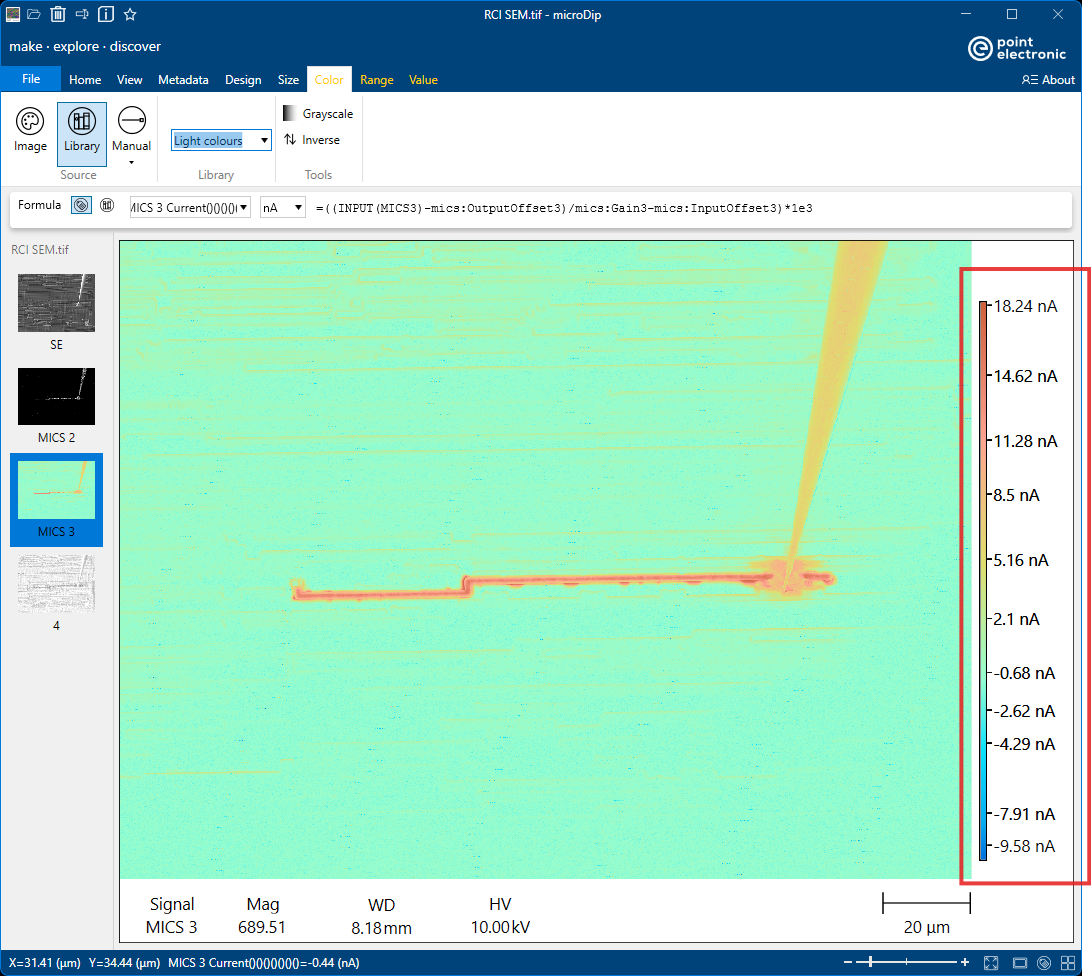
Intensity bar can be displayed horizontally, as above, or vertically, as below. Vertical intensity bar is particularly useful if the image view on display uses a colour palette with many colour segments.
If datatype is colour, then the Intensity Bar cannot be show.
Pixel Values Formulas
The basis for offline quantitative measurements is metadata information, which contains
- hardware parameters and values (metadata tags) used for signal amplification at the time of the image acquisition
- formulas that give the relationship between these metadata tags and physical signal values
Formulas are therefore essential to quantification, as they enable on-the-fly calculation of physical signal values from the raw 16-bit image values. A typical formula is shown below,
=((INPUT(MICS2)-mics:OutputOffset2)/mics:Gain2-mics:InputOffset2)*1e3
where MICS2 is the signal/channel that this formula applies to (and the selected signal in view), mics:OutputOffset2, mics:Gain2 and mics:InputOffset2 are hardware parameters used for amplification, and 1e3 is a coefficient for V/nA transformation.
On new file open, microDIP will default to RAW (ADC) pixel values and parse formulas found in the image metadata. To select a formula from metadata, use the selection menu in the formula bar, which will then allow a selection of units (e.g. nA, pA and so on).

microDIP also keeps a library of formulas, which can be accessed by pressing the Library button and then selecting which XML collection of formulas to retrieve.

If datatype is colour, 8-bit or Index8, then Formula bar cannot be shown.
Older microDIP version used a Value toolbar in the ribbon, with the same functionality as described here.
Calculated Pixel Values
Intensity (calculated value) for each pixel can be seen in the Status Bar, which displays coordinates (X and Y) from the top left corner of the image and pixel intensity for the pixel under the mouse cursor.

Histogram and line profile plots will also use the calculated pixel intensities, including selection of the minimum and maximum range, as shown in the screenshots below.
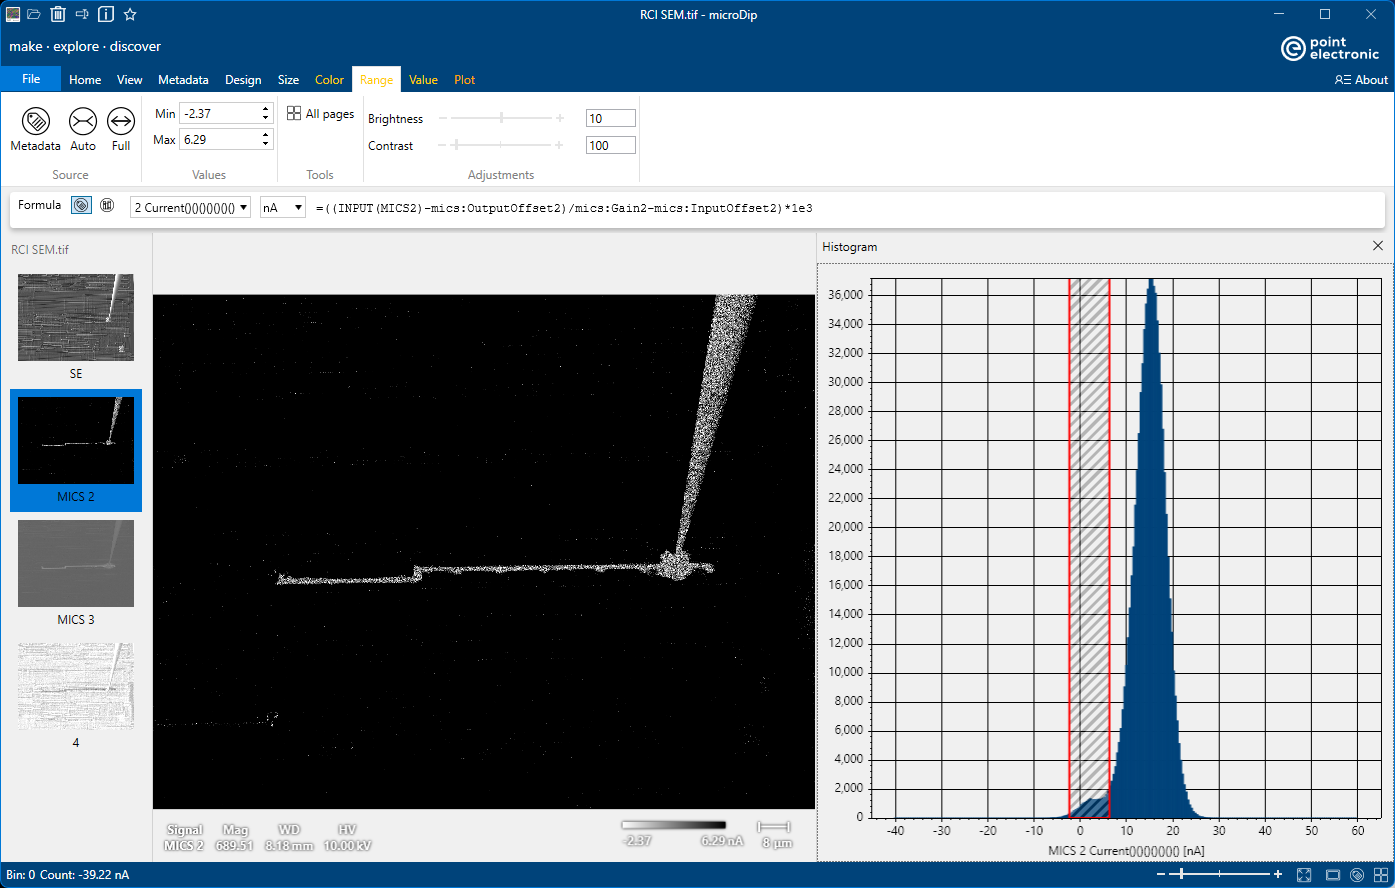
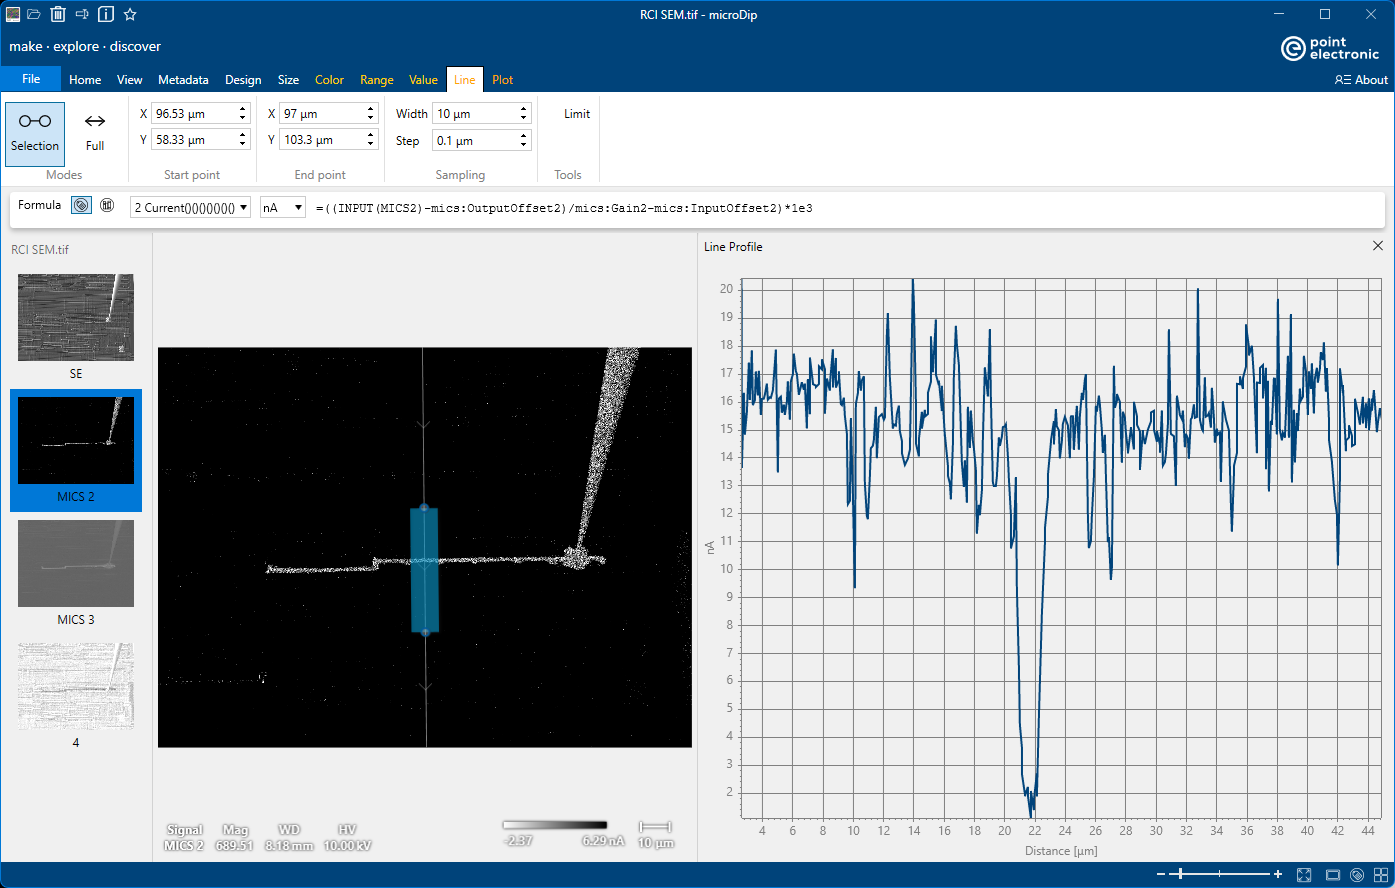
Image export, as well as plot exports, will write calculated pixel values in the new CSV files.
Quantitative Image Comparison
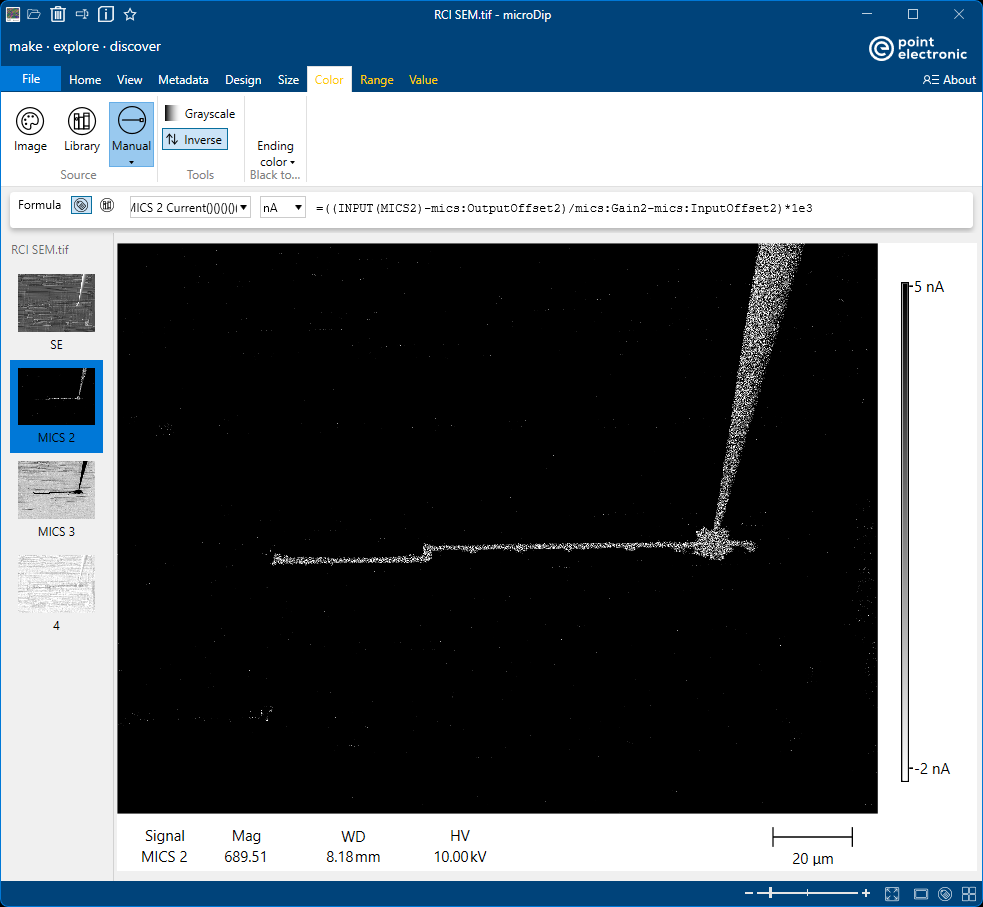
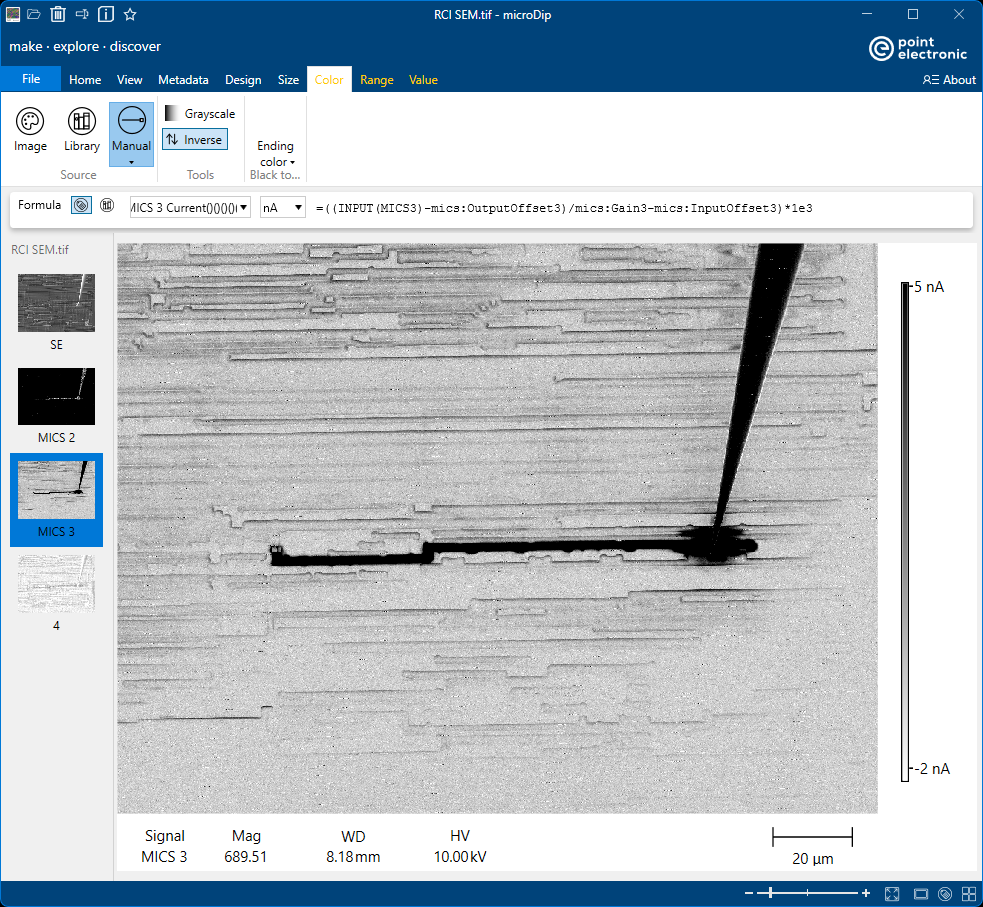
For a quantitative comparison between different signals or images, where the black and white levels are set to the same physical signal levels, set the same
- Formula in the Formula bar
- Minimum and Maximum values in the Range toolbar
- Colour and inverse in the Colour toolbar
for both signals or images, as in the example inserted below. Note that Intensity Bars in the two images have the same range -2 nA to 5 nA.