
Span toolbar
Span toolbar is conditional and only shown when a span is selected. Spans describe intervals in the data plot, used to define spectrum windows for mapping.

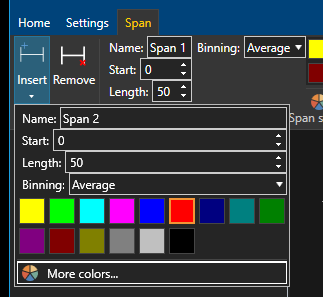
For a selected span in the spectrum pane, manually inputs in the Span toolbar are
- 'Name' which must be unique, it will be used on the left side pane of the app and in the scan control as a signal name. Typical name may be an X-ray peak name or a material.
- 'Start' gives the left-most value in Pix of the span on the plot. It may also be given by dragging the span on the plot.
- 'Length' gives the range of Pix contained in the span
- 'Binning' may be 'Average' (default), 'Sum', 'Max', 'Min' or 'Center' and is the method used to obtain a representative value from this span, which will be transmitted to the scan control app in remote mode, and used for mapping.
- 'Average': average of all values in the span
The 'Insert' and 'Remove' buttons are repeated from the Home toolbar for convenience. A popup menu will be displayed on insert, to specify parameters of a new span, as shown in the screenshot below.
A unique name must be given before a span can be inserted!