
Span toolbar
Span toolbar is conditional and only shown when a span is selected. Spans describe intervals in the data plot, used to define spectrum windows for mapping.

TheFor 'Insert'a andselected 'Remove'span buttons are repeated fromin the Homespectrum pane, manually inputs in the Span toolbar for convenience. For the selected span, it is possible to manually inputare
- 'Name' which must be unique, it will be used on the left side pane of the app and in the scan control as a signal name. Typical name may be an X-ray peak name or a material.
- 'Start' gives the left-most value in Pix or eV of the span on the plot. It may also be given by dragging the span on the plot.
- 'Length' gives the range of Pix or eV contained in the span
- 'Binning' may be 'Average' (default), 'Sum', 'Max', 'Min' or 'Center' and is the method used to obtain a representative value from this span, which will be transmitted to the scan control app in remote mode, and used for mapping.
- 'Colour' gives the colour of the span, used to highlight the span in the spectrum plot, and map colour in scan control.
The 'Insert' and 'Remove' buttons are repeated from the Home toolbar for convenience. A popup menu will be displayed on insert, to specify parameters of a new span, as shown in the screenshot below.
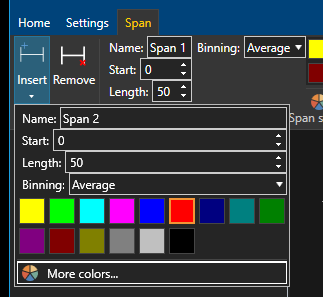
A unique name must be given before a span can be inserted!